Today (June 3, 2026), the Australian Bureau of Statistics (ABS) released the latest - Australian…
Australian National Accounts – GDP growth in decline, expect unemployment to rise – courtesy RBA sabotage
The Australian Bureau of Statistics released the latest – Australian National Accounts: National Income, Expenditure and Product, December 2022 – today (March 1, 2023), which shows that the Australian economy grew by 0.5 per cent in the December-quarter 2022 and by 2.7 per cent over the 12 months. This is a significant decline in growth, which is now insufficient to prevent unemployment from rising over the coming period. Growth is being driven largely by continued (but moderating) growth in household spending. This was augmented by the strong rebound in the Terms of Trade (commodity prices), which helped net exports make a positive growth contribution. There was growth in employee compensation (the wage measure from the national accounts) of 3.2 per cent but that was largely due to administrative decisions (for example, minimum wage increases) that impacted in this quarter rather than being the result of market pressures. Households are now saving less relative to their disposable income in an effort to maintain consumption growth in the face of rising interest rates and temporary inflationary pressures. I expect growth to decline further and we will be left with rising unemployment and declining household wealth as a result of the RBA’s poor judgement.
The main features of the National Accounts release for the December-quarter 2022 were (seasonally adjusted):
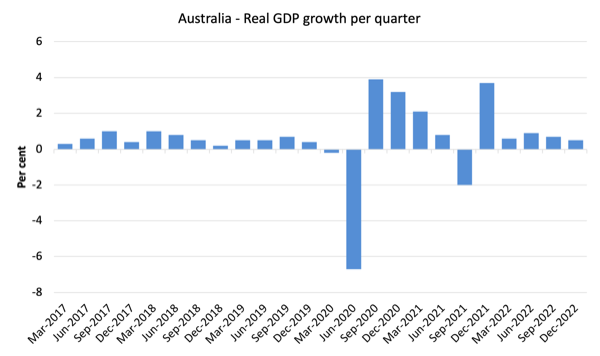
- Real GDP increased by 0.5 per cent for the quarter (down from 0.6 per cent last quarter). The annual growth rate was 2.7 per cent
- Australia’s Terms of Trade (seasonally adjusted) rose by 0.6 per cent (up from -5.9 per cent in the quarter and by 7.2 per cent over the 12 month period.
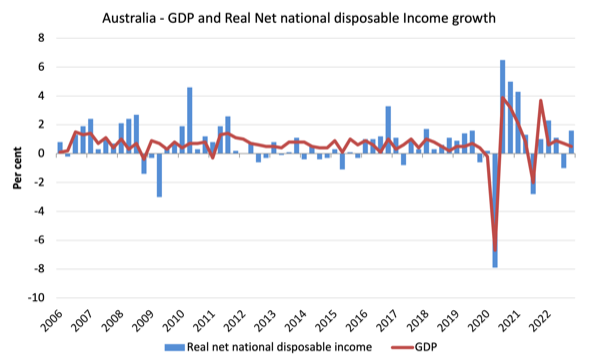
- Real net national disposable income, which is a broader measure of change in national economic well-being, rose by 1.6 per cent for the quarter and by 4 per cent over the 12 months, which means that Australians are better off (on average) than they were at that point 12 months ago.
- The Household saving ratio (from disposable income) fell from 7.1 per cent to 4.5 per cent. So the squeeze on household wealth is having an effect.
Overall growth picture – growth continues at slower rate
The ABS – Media Release – said that:
Australia’s Gross Domestic Product (GDP) rose 0.5 per cent … in the December quarter 2022 and by 2.7 per cent through the year … Although this is the fifth consecutive rise in quarterly GDP, growth slowed in each of the last two quarters. …
The 0.4 per cent rise in total consumption and 1.1 per cent rise in exports were the primary contributors to GDP growth in the December quarter. Continued growth in household and government spending drove the rise in consumption, while increased exports of travel services and continued overseas demand for coal and mineral ores drove exports …
Private gross fixed capital formation fell 1.7 per cent in the December quarter …
The household saving ratio continued to decline in the December quarter, to the lowest level since September 2017. The fall was driven by increased interest payable on dwellings, income tax payable and increased spending …
Net trade contributed 1.1 percentage points to GDP, as exports increased 1.1 per cent and imports fell 4.3 per cent.
The first graph shows the quarterly growth over the last five years.
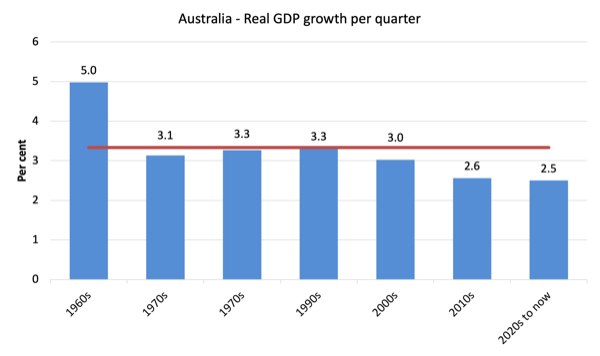
To put this into historical context, the next graph shows the decade average annual real GDP growth rate since the 1960s (the horizontal red line is the average for the entire period (3.3 per cent) from the December-quarter 1960 to the December-quarter 2022).
The 2020-to-now average has been dominated by the pandemic.
But, it is also obvious how far below historical trends the growth performance of the last 2 decades have been as the fiscal surplus obsession has intensified on both sides of politics.
Even with a massive household credit binge and a once-in-a-hundred-years mining boom that was pushed by stratospheric movements in our terms of trade, our real GDP growth has declined substantially below the long-term performance.
The 1960s was the last decade where government maintained true full employment.
Analysis of Expenditure Components
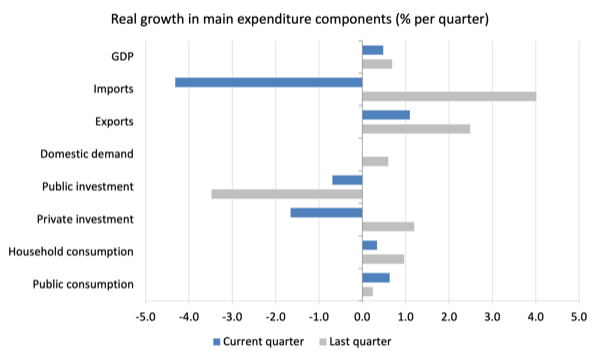
The following graph shows the quarterly percentage growth for the major expenditure components in real terms for September-quarter 2022 (grey bars) and the December-quarter 2022 (blue bars).
Points to note for the December-quarter:
1. Household Consumption expenditure rose by 0.34 per cent (down from 0.96 per cent) – so not only is spending growth declining but saving is being rundown to support the current declining growth.
2. General government consumption expenditure rose by 0.63 per cent (up from 0.24 per cent).
3. Private investment expenditure growth fell by 1.66 per cent. Over the year, it fell by -1.3 per cent.
4. Public investment fell by 0.7 per cent.
5. Export expenditure rose by 1.1 per cent (down from 2.5 per cent). Imports growth was negative (-4.3 per cent). The travel binge is in retreat,
Contributions to growth
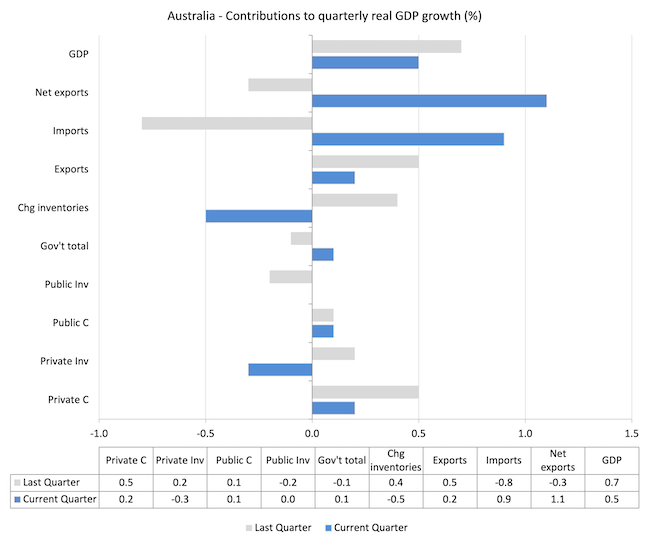
What components of expenditure added to and subtracted from the 0.5 per cent rise in real GDP growth in the December-quarter 2022?
The following bar graph shows the contributions to real GDP growth (in percentage points) for the main expenditure categories. It compares the December-quarter 2022 contributions (blue bars) with the previous quarter (gray bars).
In no order:
1. Household consumption expenditure added 0.2 points to the overall growth rate of 0.5 per cent (down from 0.5 points).
2. Private investment expenditure subtracted -0.3 points (after adding 0.2 points last quarter).
3. Public consumption added 0.1 points this quarter after adding 0.1 points last quarter.
4. Public Investment added nothing this quarter (after subtracting -0.2 points last quarter).
5. Overall, the government sector added 0.1 point to growth (after subtracting 0.1 point last quarter).
6. Growth in inventories subtracted 0.5 points (after adding 0.4 points last quarter).
7. Net exports added 1.1 points to growth with exports (0.2 points) being complemented by the decline in imports (-0.9 points) – remember imports are a drain on expenditure.
Material living standards rose in December-quarter
The ABS tell us that:
A broader measure of change in national economic well-being is Real net national disposable income. This measure adjusts the volume measure of GDP for the Terms of trade effect, Real net incomes from overseas and Consumption of fixed capital.
While real GDP growth (that is, total output produced in volume terms) rose by 0.5 per cent in the December-quarter, real net national disposable income growth rose by 1.6 per cent.
How do we explain that?
Answer: The terms of trade recovered from their negative result in the September-quarter and rose by 0.6 per cent for the quarter.
The ABS noted that “The terms of trade rose 7.2 per cent through the year, driving real gross domestic income to 4.4 per cent through the year. This lifted the purchasing power generated by real GDP.”
Household saving ratio fell by 2.6 points to 4.5 per cent
The ABS noted that:
The household saving ratio continued to decline in the December quarter, to the lowest level since September 2017. The fall was driven by increased interest payable on dwellings, income tax payable and increased spending …
With inflation temporarily at elevated levels and interest rates now being pushed up by the RBA, the squeeze on income is seeing households maintaining growth in consumption expenditure by reducing their saving rate.
Digging into savings to maintain the flow of consumption spending undermines household wealth.
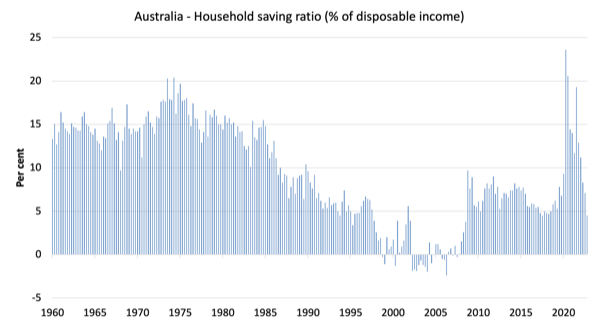
The following graph shows the household saving ratio (% of disposable income) from the December-quarter 2000 to the current period. It shows the period leading up to the GFC, where the credit binge was in full swing and the saving ratio was negative to the rise during the GFC and then the most recent rise.
The current position is that households are being squeezed by a combination of rising living costs and interest rates and flat wages growth, which is driving a gap between income and expenditure.
If this trend continues, Australia will go back to the pre-GFC period when the household saving ratio was negative and consumption growth was sustained by increasing debt.
However, with household debt so high, it is likely that households will cut back consumption spending and the economy will head towards recession.
It will be a deliberate act of sabotage engineered by the RBA.
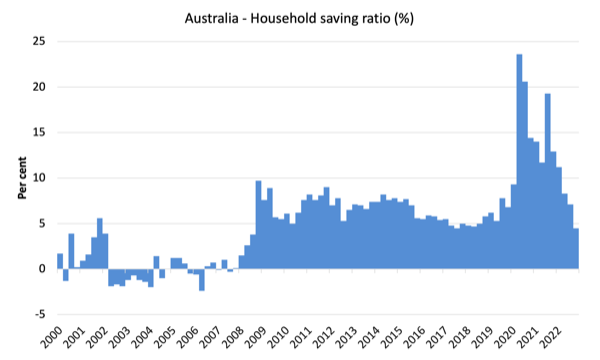
The next graph shows the household saving ratio (% of disposable income) from the December-quarter 1960 to the current period.
Back in the full employment days, when governments supported the economy and jobs with continuous fiscal deficits (mostly), households saved significant proportions of their income.
In the neoliberal period, as credit has been rammed down their throats, the saving rate dropped (to negative levels in the lead-up to the GFC).
Hopefully, households are paying off the record levels of debt they are now carrying and improving their financial viability.
The following table shows the impact of the neoliberal era on household saving. These patterns are replicated around the world and expose our economies to the threat of financial crises much more than in pre-neoliberal decades.
The result for the current decade (2020-) is the average from March 2020.
| Decade | Average Household Saving Ratio (% of disposable income) |
| 1960s | 14.4 |
| 1970s | 16.2 |
| 1980s | 11.9 |
| 1990s | 5.0 |
| 2000s | 1.4 |
| 2010s | 6.5 |
| 2020- | 13.1 |
Real GDP growth rose by less than working hours – resulting in a fall in labour productivity growth
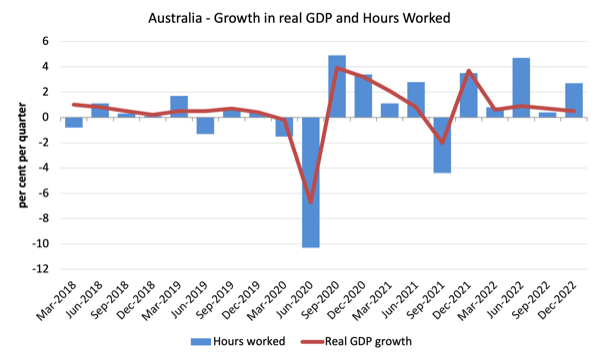
The following graph presents quarterly growth rates in real GDP and hours worked using the National Accounts data for the last five years to the December-quarter 2022.
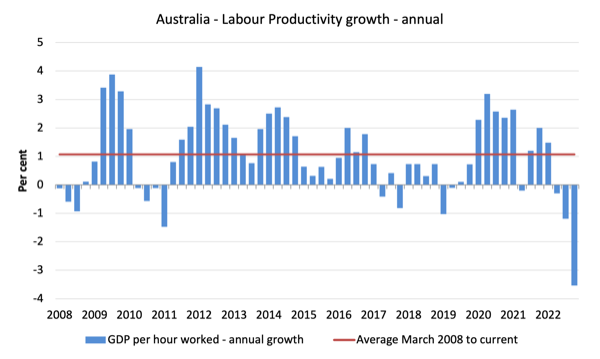
To see the above graph from a different perspective, the next graph shows the annual growth in GDP per hour worked (labour productivity) from the December-quarter 2008 quarter to the December-quarter 2022. The horizontal red line is the average annual growth since December-quarter 2008 (1.1 per cent), which itself is an understated measure of the long-term trend growth of around 1.5 per cent per annum.
The relatively strong growth in labour productivity in 2012 and the mostly above average growth in 2013 and 2014 helps explain why employment growth was lagging given the real GDP growth. Growth in labour productivity means that for each output level less labour is required.
The data shows that real output rose by 0.5 per cent, while hours worked rose by 2.7 per cent during the December-quarter.
The result is that GDP per hours worked fell by -3.5 per cent for the quarter the third successive quarter of declining productivity growth.
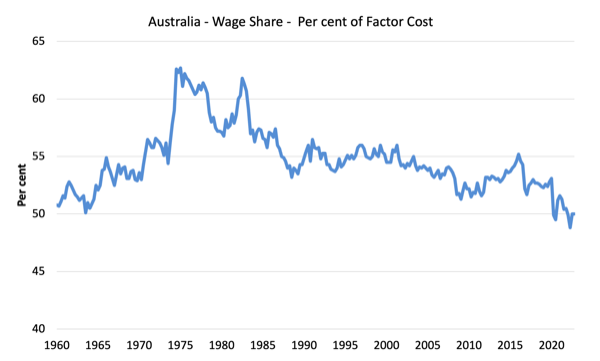
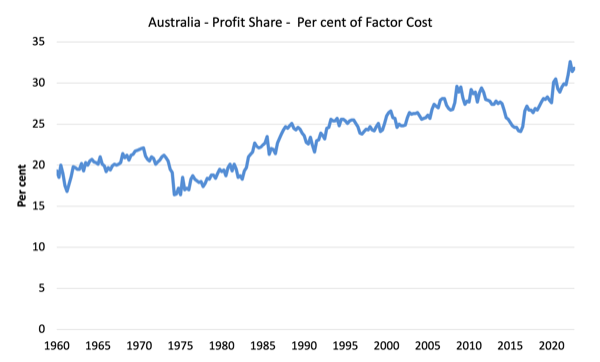
The distribution of national income – mostly stable
The wage share in national income remained at 50 per cent while the profit share rose by 0.4 points as the terms of trade improved and corporations recorded record profit levels.
But as the following graphs show, this shift is minor in the face of the recent trends.
The first graph shows the wage share in national income while the second shows the profit share.
The declining share of wages historically is a product of neoliberalism and will ultimately have to be reversed if Australia is to enjoy sustainable rises in standards of living without record levels of household debt being relied on for consumption growth.
Wages and Prices
Everyone was waiting to see what the National Accounts data could tell us about the extent of wage pressure and price inflation.
The data shows that:
1. “Compensation of employees increased 2.1 per cent” in the December-quarter but was down from 3.2 per cent in the September-quarter 2022.
2. “The GDP Implicit price deflator (IPD) rose 1.6 per cent in the December quarter and 9.1 per cent through the year. Domestic prices grew strongly, up 1.4 per cent for the quarter and 6.6 per cent through the year. This was the strongest through the year growth in domestic prices since the March quarter 1990.”
The Wage Price Index data is a more accurate gauge of wage pressure and I wrote about that in this blog post – Real wages in Australia continue to plunge but the RBA still falsely claims that wage pressure justifies interest rate hikes (February 22, 2023).
The National Accounts data is three months old and suggests that wage pressure is in retreat. The WPI data confirmed that.
The IPD result will probably be used by the RBA as cover for their next rate rise in March.
What they should realise is that spending is still rising on the back of wealth liquidation in an environment of weakening growth.
The 2.7 per cent annual rate of GDP growth in the December-quarter is insufficient to keep unemployment from rising.
And remember, when the RBA finally work out their policy is starting to impact on spending, it will be too late, the rates will have risen too much.
Conclusion
Remember that the National Accounts data is three months old – a rear-vision view – of what has passed and to use it to predict future trends is not straightforward.
The data tells us that after the initial rebound from the lockdowns, growth continued to be moderate in the December-quarter and was driven by household consumption expenditure and a rebound in the terms of trade (commodity prices).
Households are now saving less relative to their disposable income in an effort to maintain consumption growth in the face of rising interest rates and temporary inflationary pressures.
I expect growth to decline further and we will be left with rising unemployment and declining household wealth as a result of the RBA’s poor judgement.
That is enough for today!
(c) Copyright 2023 William Mitchell. All Rights Reserved.
Australia, like the UK and many parts of the Eurozone, and like Singapore, seems never fully to have recovered from the GFC (as illustrated by the declines in the growth rates of real GDP and net national disposable income over the last 15+ years).
Australia illustrates our environmental predicament well. The economy in Australia is ENTIRELY dependent on mining (including plenty of coal), and on consumers. How does one reduce the environmental impact of the basic materials and consumer cyclicals sectors without sending an economy like Australia’s into a tailspin?
Funnily enough, JOHN B, all of those economies have been battered by neoliberal austerity.
And the prevalence of mining is political, while the need for private consumption is structural, given the austerity bias of governments. Private consumption fills the spending void created by the fiscal retreat of government.
Reply to John B.
Since you ask… Australia can avoid a “tailspin” by investing in what they need, and maybe becoming world leaders in those fields. Like mass sustainable desalination (and good use of the by products, like molten salt nuclear reactors) and mass Public solar power infrastructure.
Also , astronomy is good in Australia, if you can build a few mountains, and rain shadow the Kiwis (jokin’.)